Project finance modeling is a distinct discipline. Unlike corporate finance models that forecast a company's consolidated financials, PF models simulate a single asset, a toll road, a power plant, a data center, in granular detail over a 20-40 year concession life.
If you're moving into infrastructure, energy, or PPP advisory, understanding these models is non-negotiable. This guide covers the core concepts every analyst needs.
How Project Finance Differs from Corporate Finance
| Dimension | Corporate Finance | Project Finance |
|---|---|---|
| Entity | Operating company with multiple assets | Single-purpose vehicle (SPV) with one asset |
| Recourse | Full recourse to the parent balance sheet | Non-recourse or limited recourse to sponsors |
| Revenue source | Diversified revenue streams | Contracted or regulated cash flows |
| Debt tenor | 3-7 year revolving/term facilities | 15-30 year amortizing facilities |
| Key metric | EV/EBITDA, P/E | DSCR, LLCR, PLCR |
| Modeling horizon | 5-10 year DCF | 20-40 year full-life cash flow |
| Equity return | IRR on LBO or DCF basis | Equity IRR after debt service |
The fundamental difference: in project finance, lenders rely on the project's cash flows, not the sponsor's creditworthiness, for repayment. This means the model must prove the asset can service debt under multiple scenarios.
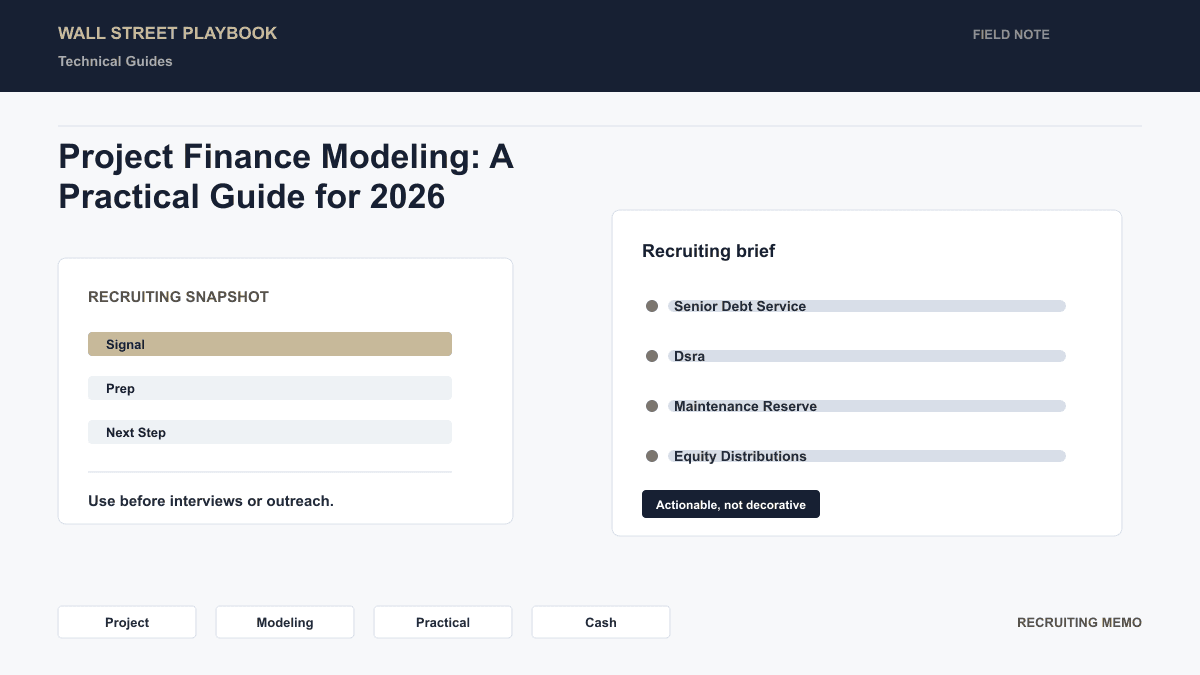
The Cash Flow Waterfall
The waterfall is the backbone of every PF model. Cash flows are distributed in a strict priority order defined by the credit agreement. Understanding this hierarchy is essential.
Standard Waterfall Structure
- Revenue, Contracted (PPA, offtake agreement) or merchant
- (-) Operating Expenses, O&M, insurance, land lease, management fees
- (-) Taxes, Corporate tax on project earnings
- = Cash Flow Available for Debt Service (CFADS)
- (-) Senior Debt Service, Interest + scheduled principal repayment
- (-) Debt Service Reserve Account (DSRA) Top-Up, Maintain 6-month reserve
- (-) Maintenance Reserve Account (MRA) Top-Up, Fund capex reserves
- (-) Cash Sweep (if applicable), Excess cash applied to accelerated repayment
- (-) Subordinated Debt Service, Mezzanine or shareholder loans
- = Cash Flow Available for Distribution (CFAD)
- (-) Equity Distributions, Dividends to sponsors (subject to lock-up tests)
Modeling the Waterfall
Each line of the waterfall is a separate calculation block in the model. The key challenge: circular references. Debt service depends on debt balance, which depends on drawdowns, which depend on construction timing, which feeds back into the waterfall.
Most PF models handle circularity with an iterative calculation toggle or a macro that converges the circular references. This is a technical skill you'll develop with practice.
DSCR: The Central Metric
The Debt Service Coverage Ratio measures how comfortably the project's cash flows cover its debt obligations.
DSCR = CFADS ÷ Debt Service
| DSCR Level | Interpretation |
|---|---|
| < 1.00x | Cash flows don't cover debt service, default territory |
| 1.00x-1.10x | Razor-thin coverage, too risky for most lenders |
| 1.10x-1.20x | Acceptable for contracted/regulated projects |
| 1.20x-1.40x | Comfortable range for most infrastructure assets |
| 1.40x-1.60x | Conservative, typical for merchant power or riskier profiles |
| > 1.60x | Very conservative, may indicate under-leverage |
Types of DSCR
- Annual DSCR: Calculated for each period, shows coverage over time
- Minimum DSCR: The lowest annual DSCR across the debt tenor, the binding constraint
- Average DSCR: Mean DSCR across the debt life, less useful than the minimum
DSCR Targets by Asset Type
| Asset Type | Typical Min DSCR | Rationale |
|---|---|---|
| Contracted renewable (solar, wind) | 1.15x-1.25x | Predictable cash flows, weather risk |
| Availability-based PPP (hospital, school) | 1.10x-1.20x | Government-backed payments |
| Regulated utility | 1.20x-1.30x | Regulatory revenue certainty |
| Toll road | 1.30x-1.50x | Traffic volume risk |
| Merchant power plant | 1.40x-1.60x | Commodity price exposure |
| Data center / telecom | 1.25x-1.40x | Contracted but technology risk |
Get 20 must-know technical questions
Use the free PDF as a baseline before you move into deeper technical prep.
No spam. Unsubscribe anytime.
Debt Sculpting
Sculpting is the technique of shaping debt repayment to match the project's cash flow profile, maintaining a constant target DSCR in every period.
How It Works
Instead of level amortization (equal principal payments), sculpted debt service varies each period so that:
Debt Service = CFADS ÷ Target DSCR
This means:
- In high-revenue periods, the project repays more principal
- In low-revenue periods (e.g., seasonal dip, major maintenance year), repayments drop
- The DSCR remains flat at the target level
Sculpting Example
| Period | CFADS ($M) | Level Amortization DS | Level DSCR | Sculpted DS | Sculpted DSCR |
|---|---|---|---|---|---|
| Year 1 | 15.0 | 10.0 | 1.50x | 11.5 | 1.30x |
| Year 2 | 12.0 | 10.0 | 1.20x | 9.2 | 1.30x |
| Year 3 | 8.0 | 10.0 | 0.80x | 6.2 | 1.30x |
| Year 4 | 14.0 | 10.0 | 1.40x | 10.8 | 1.30x |
| Year 5 | 16.0 | 10.0 | 1.60x | 12.3 | 1.30x |
Notice Year 3 under level amortization: DSCR falls below 1.0x, a technical default. Sculpting eliminates this by reducing repayments to match the lower cash flow.
Why Sculpting Matters
- Maximizes leverage: By avoiding periods where DSCR dips below the minimum, the project can support more debt
- Eliminates unnecessary cash traps: Level amortization wastes coverage in high-CFADS periods
- Matches economic reality: Project cash flows are rarely flat, so repayments shouldn't be either
Debt Sizing
Sizing determines the maximum debt the project can support. There are three main approaches, and lenders typically use all three, with the most conservative result as the binding constraint.
| Method | Formula | What It Tests |
|---|---|---|
| DSCR-based | Max DS each period = CFADS ÷ Target DSCR | Can the project cover debt service every period? |
| LLCR-based | NPV(CFADS over debt life) ÷ Debt Outstanding ≥ Target | Is total remaining cash flow sufficient to repay? |
| PLCR-based | NPV(CFADS over project life) ÷ Debt Outstanding ≥ Target | Including tail period cash flows |
| Gearing-based | Debt ÷ Total Project Cost ≤ Max Gearing % | Sponsor equity commitment minimum |
Recommended Resource
Finance Technical Interview Guide
80+ pages. Every question tagged by frequency with answer formats, red flags, and practice structure.
LLCR and PLCR
- Loan Life Coverage Ratio (LLCR): NPV of CFADS from today to final debt maturity, divided by outstanding debt. Typical minimum: 1.20x-1.40x.
- Project Life Coverage Ratio (PLCR): Same as LLCR but extends to end of concession. Includes the "tail", cash flows after debt is repaid. Typical minimum: 1.30x-1.50x.
The tail period is important because it provides a buffer: if the project underperforms during the debt period, there's still cash flow afterward to repay restructured debt.
Key Model Architecture Principles
1. Semi-Annual or Quarterly Periodicity
PF models typically use semi-annual periods (matching debt service payment frequency), not annual. This adds complexity but reflects contractual reality.
2. Construction and Operations Phases
The model must handle two distinct phases:
- Construction: Drawdowns, IDC (interest during construction), construction contingency, sponsor equity contributions
- Operations: Revenue generation, waterfall mechanics, debt service
The transition, called "COD" (Commercial Operations Date), is a critical model milestone.
3. Scenario and Sensitivity Analysis
Every PF model includes a sensitivity module. Standard sensitivities:
| Variable | Typical Range |
|---|---|
| Revenue / volume | ±10-20% |
| Operating costs | ±5-15% |
| Construction cost overrun | +10-25% |
| Interest rates | +100-200 bps |
| Inflation | ±1-2% |
| Delay to COD | 3-12 months |
Lenders stress-test the model extensively. A good model makes this easy with clearly labeled assumption toggles.
4. Flag-Based Logic
PF models rely heavily on Boolean flags (1/0) to control timing:
- Construction period flag
- Operations period flag
- Debt service period flag
- Cash sweep trigger flag
- Distribution lock-up flag
This approach keeps formulas readable and auditable, critical when lenders' model auditors review your work.
Building Your PF Modeling Skills
| Resource | Value | Cost |
|---|---|---|
| Corality / Mazars training | Industry-standard PF modeling courses | $1,500-$3,000 |
| BIWS Project Finance course | Self-paced, detailed | ~$500 |
| IJ Global / Proximo | Deal databases for real-world precedents | Subscription |
| Build from scratch | Download a renewable energy PPA and model the project | Free |
The best way to learn is to build a model from scratch for a real asset type, a 100MW solar project with a 20-year PPA is a good starting point.
Targeting project finance roles? Our Project Finance Resume page helps you position infrastructure, energy, and PPP experience for top advisory and lending teams.
Related Reading
- How the Three Financial Statements Are Linked, Foundation for all financial modeling
- LBO Model Walkthrough: 5 Steps, Compare LBO modeling to PF modeling
- Walk Me Through a DCF: Perfect Answer, Corporate finance modeling fundamentals